How deep SP500 can go?
Thursday, November 11 finally OPEC released its monthly outlook, where it cuts the global oil demand for the last quarter of 2021, as inflation will slow down the economic recovery. According to the OPEC monthly report, to reach the same demand level of pre-pandemic, we need to wait until the last quarter of 2022.
According to the report, OPEC sees no change in global economic recovery and remains its previous expectations of 5.6% and 4.2% respectively for 2021 and 2022. However, for the United States, as the third quarter's estimates decrease, for annual growth in 2021 and 2022 also we can see some changes to decrease the estimates to 5.5% in 2021 and 4.1% in 2022. This weakness in the US estimates will be covered with a slightly revised up in the Eurozone GDP to 5.1% for 2021. However, 2022 estimates at 3.9% are unchanged. Chinese, Japanese and Russian economies grow also will be unchanged in 2022 with earlier estimates. For 2021, we can see just a bit of a slowdown in Japanese economic recovery.
For Oil demand, it is expected to see the 330K bpd decrease in global demand from October estimates. The expectation for the fourth quarter global Oil demand will be 99.49 million barrels per day (bpd) on average. The 2021 annual demand growth forecast was also decreased by 160,000 bpd to 5.65 million bpd.
As faster economic recovery is good for Oil demand and its price, however, the Oil price is not good for economic growth. Expensive Oil will increase the prices and PPI, therefore we will see higher CPI, and then, less demand for products and lower GDP will be the result.
As the report shows, OPEC output in October increased by 220K bpd to 27.45 million bpd. Saudi Arabia provides half this increase. Four of the 13 OPEC members also had less output due to a lack of capacity.
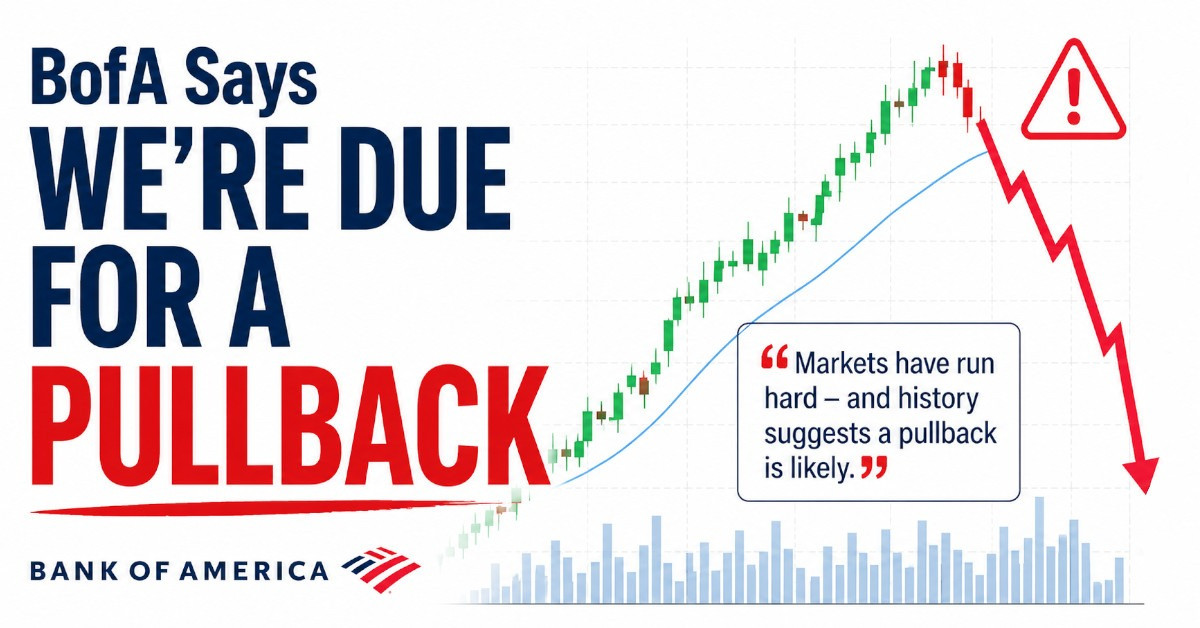
In the stock markets, today and after earlier slight gain, now we can see the Dow Jones trading in Red zone by 0.3% losing and SP500 also lost some of its earlier gains and now at 4653 trading up by 0.1%. With these growth expectations and inflation levels, we can see weakness in its futures chart. From the technical point of view also, for the first time since mid-October, we can see the price under the 50 MA line in the H4 chart. As we can see in the bellow chart also, 20 and 50 DMA respectively at 4,598 and 4,489 are the next support, and by year-end, we can see them be touched, if the asset price will hold under 4,650.