Copper has been doing well lately, even though the economy is slowing down and more people are losing their jobs. This is because the central banks are keeping interest rates high, which is making it harder for businesses to borrow money and invest. This is likely to slow down the economy even more, which could eventually hurt demand for copper.
However, copper prices are still high, and they are close to reaching their highest level in a long time. This suggests that there is still a lot of demand for copper, even if the economy is slowing down. It will be interesting to see what happens next.
Let’s look at the daily chart
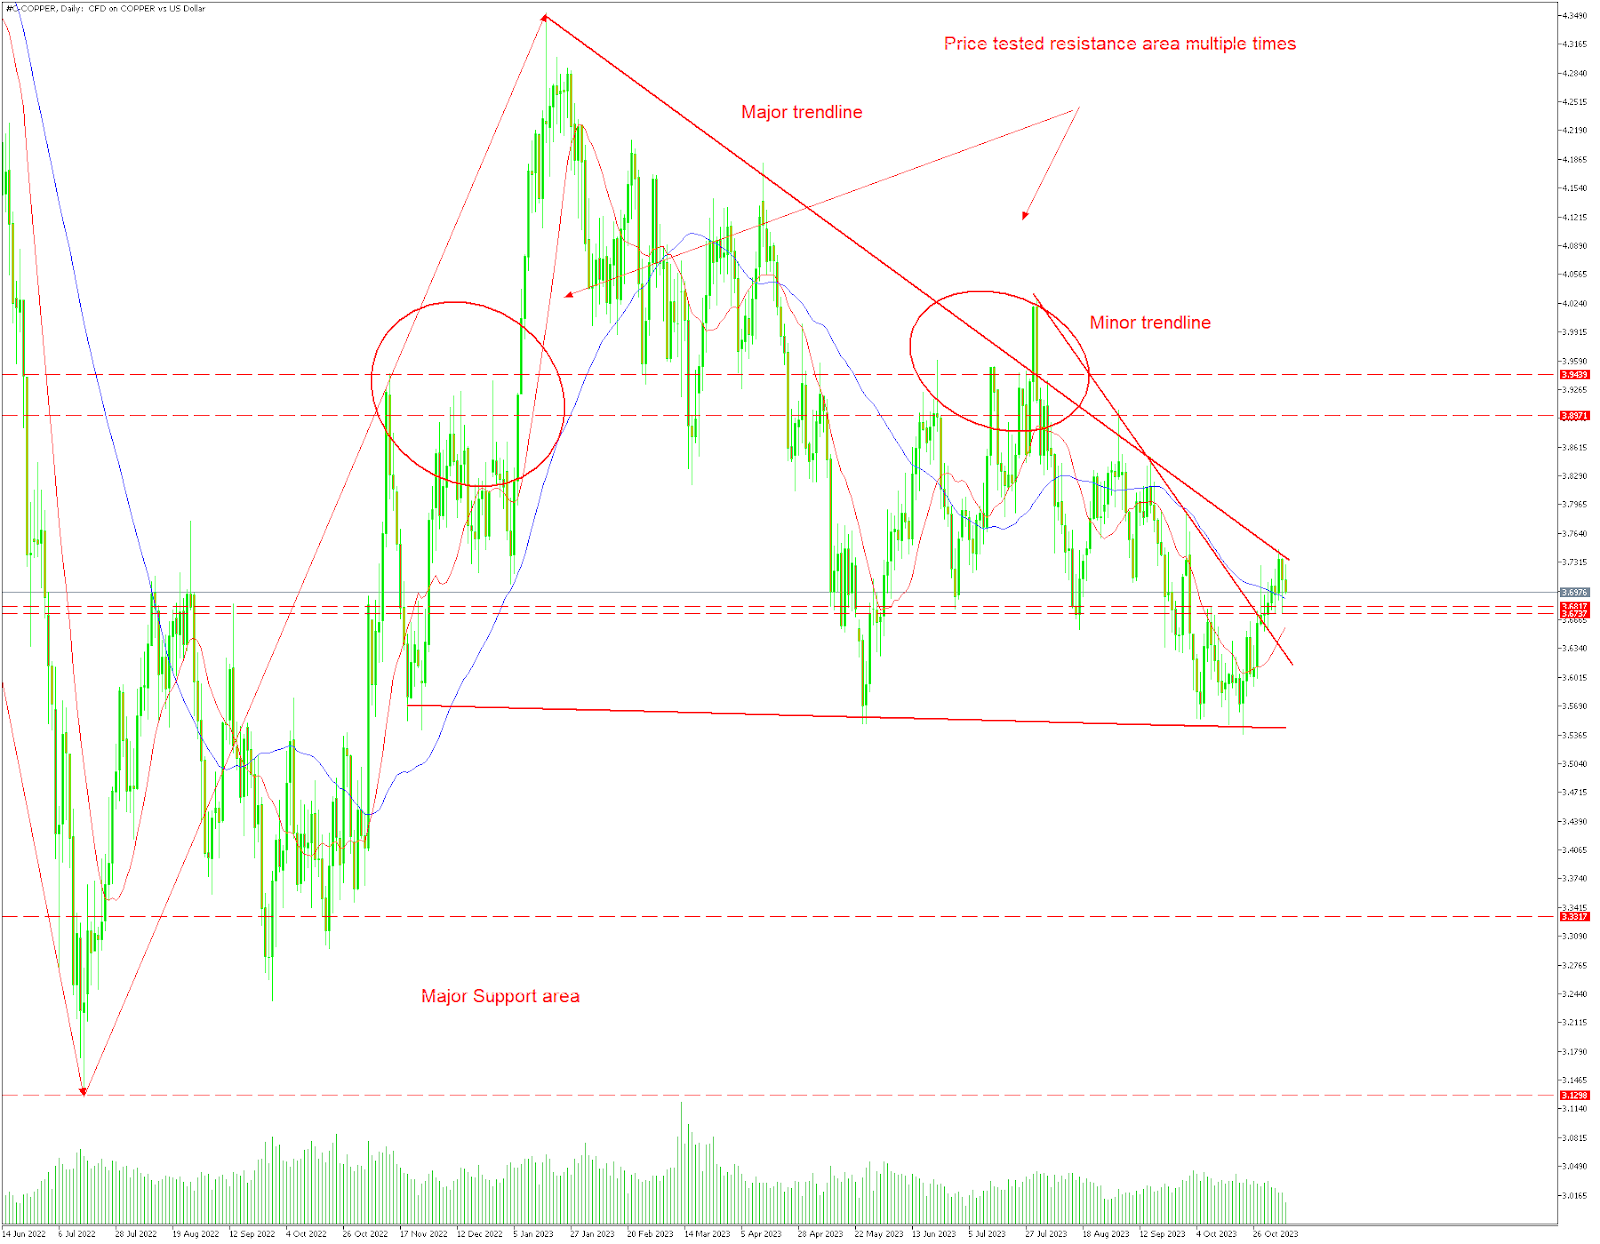
If you check out the daily chart, you`ll notice that Copper recently reached the upper boundary of a descending triangle marked by a trendline at about 3.75, but it didn`t break through – it bounced back. This is when the sellers got more active, gearing up for a potential drop back to the 3.55 support level, and they might even aim for a breakthrough below that.
On the other hand, the buyers are likely hoping for the price to break above this trendline, which would go against the bearish trend and could set the stage for a move up to around 3.90 resistance.
Now let’s lower the time frame to 4 hour chart and take a look at the situation there.
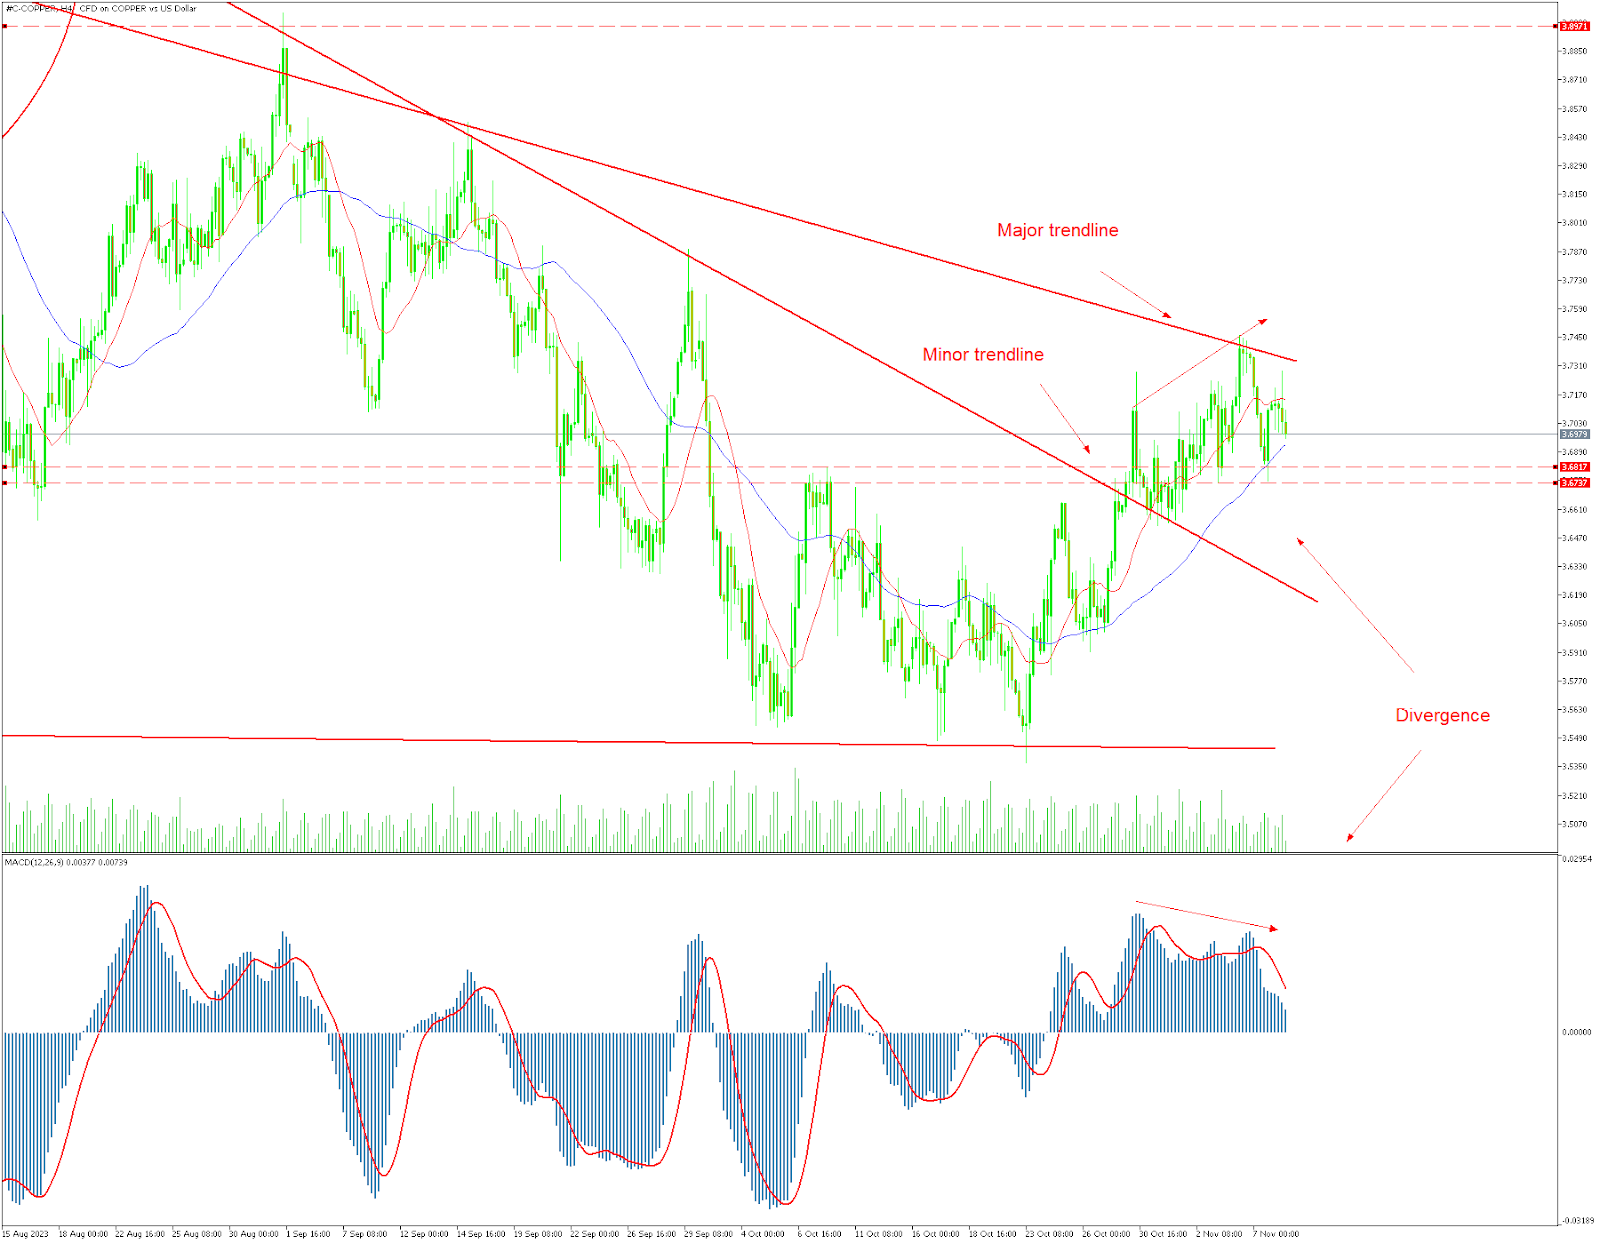
If you look at the 4-hour chart, you`ll see that Copper made a recent move by breaking above a smaller trendline. This prompted the buyers to become more confident and increase their bets, pushing the price closer to a bigger trendline. What`s interesting is that the price is showing a divergence with the MACD indicator just as it`s getting near this significant trendline.
Now, when we talk about divergence, it`s usually a sign that the momentum might be losing steam, and this can sometimes lead to pullbacks or even reversals in the price direction. So, in this case, this divergence could add another layer of evidence to the bearish setup, suggesting that a downward move might be in the cards.
Now let’s see what’s going on in 1 hour time frame
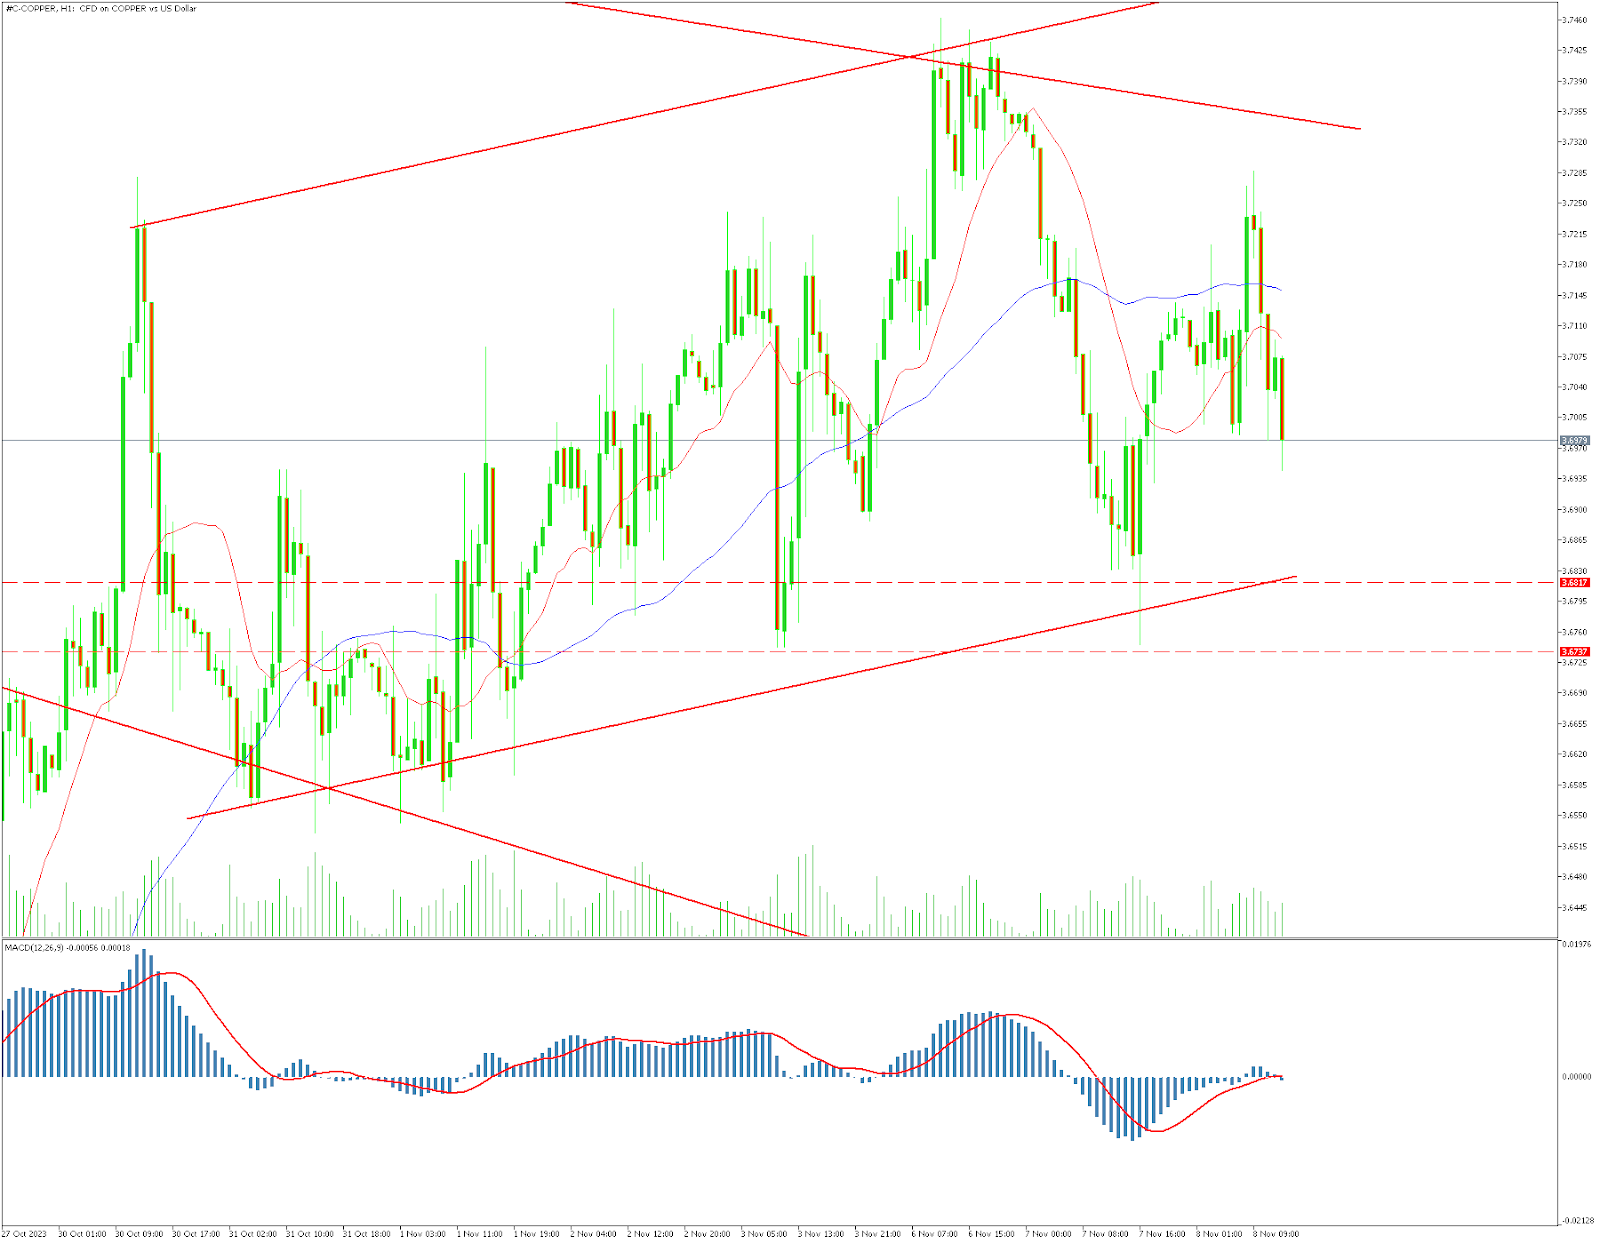
Checking out the 1-hour chart, you`ll notice that the price is currently trading within a rising channel, and it`s approaching a significant trendline. If it happens to break below the lower boundary of this channel, it could invite more selling activity, with sellers aiming for a move down to the 3.55 support level.
Conversely, if you`re in the buyer`s camp, you`d be keeping an eye out for a breakthrough above that key trendline and the upper boundary of the channel. If that occurs, it could negate the bearish scenario and set the stage for a potential move up to around the 3.90 level.
In Conclusion
The current copper market presents an intriguing conundrum. Despite a sluggish economy and rising unemployment, copper prices have managed to stay robust. The persistence of high copper prices suggests that demand for this essential industrial metal remains strong, even in the face of economic headwinds and central banks maintaining high-interest rates.