Higher risks and lower bonds are what we can guess with more probability.
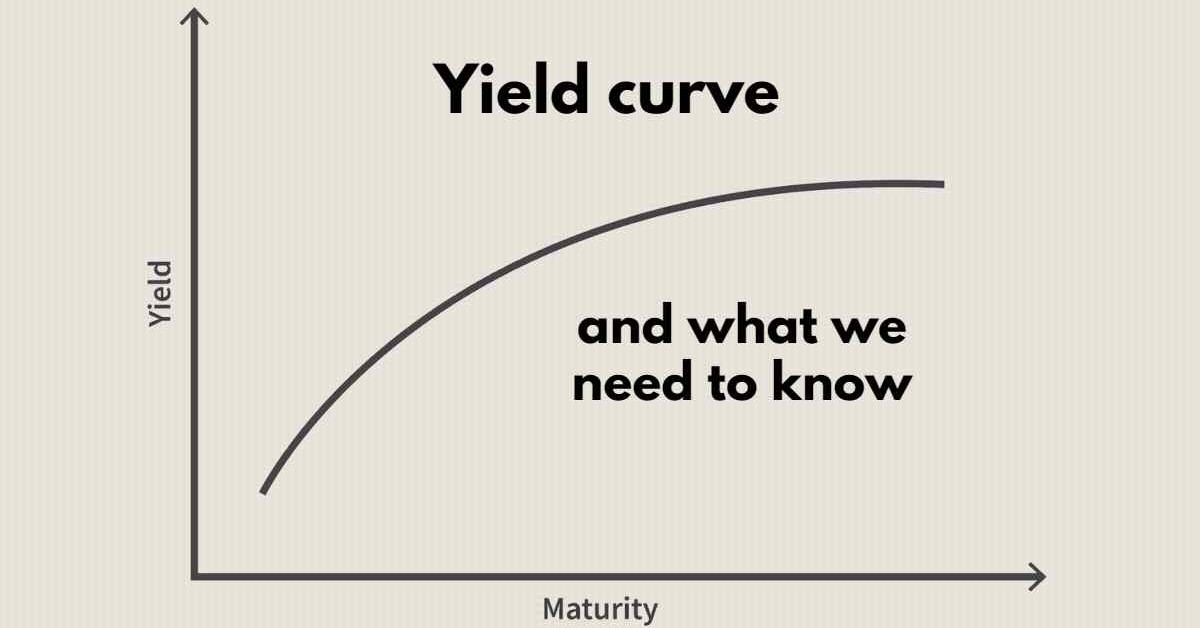
The yield curve graphs the relationship between bond yields and bond maturity. It captures the perceived risks of bonds with various maturities to bond investors. (Investopedia)
Bond duration could be different. US Treasury issues bonds with a minimum of month maturity and a maximum of 30 years. Since the yields on bonds are mainly calculated based on the risks and longer-term bonds, have more risk. Therefore they have higher yields.
While yields usually increase by increasing the number of issued years, we also have flat and inverted curves. A flat curve means that short and long-term yields are approximately the same, and an inverted curve means that longer-term bonds have fewer yields or short-term bonds have higher yields. Regardless of the reason, an inverted curve means possible economic recession.
Conditions currently in the global financial markets affected the bond market. With increasing risks, the market's safe-haven demand for bonds has heated up, and global bond yields have declined. For 10-year bonds, yields recorded 3.42% in the US, 3.05% in the UK, and 1.78% in Germany.
Most of the signs we get these days are from different market sectors, are about improving the risks. As you can see in the below figure of the US VIX chart, after testing 22.50, market risk started to increase again, and now it is moving higher above 24.50. Therefore, we must wait for higher risks and lower Yields in the short term.


