Whenever we are looking at strategies the first thing we have to understand is as a beginner it is great to understand technical analysis, candlesticks and their patterns, but it’s not enough for profitable trading.
In order to get profits you will need to have an advantage over markets and the way we get there is by having a consistent way of trading. Having consistent trading is what is called trading strategy.
Look for 4 main components
- Conditions - trend, indicators lining up, support resistance, area of value etc.
- Entry - reason why to place a trade for example a candlestick pattern
- Stop Loss - where to cut losses if price went in other direction
- Take Profit - where to get out from the trade if the price went in the right direction

Conditions - We are going to use 20 EMA as trend identification and as area of value
Entry - we are going to wait hammer, shooting star candlestick pattern to touch 20 EMA and wick off if it (20 EMA serves as a support or resistance level and when shooting star wick off of 20 EMA it tells us that there is a buying/selling pressure). At a close of the above mentioned candlestick pattern would be our entry point.
Stop Loss - we are going to place 1xATR below/above the low/high of our shooting star/hammer candlestick pattern.
Take Profit - 1/1 or 1.4/1 R/R reward to risk.
Let's take a look at an example of a candlestick trading strategy with a downtrend version.
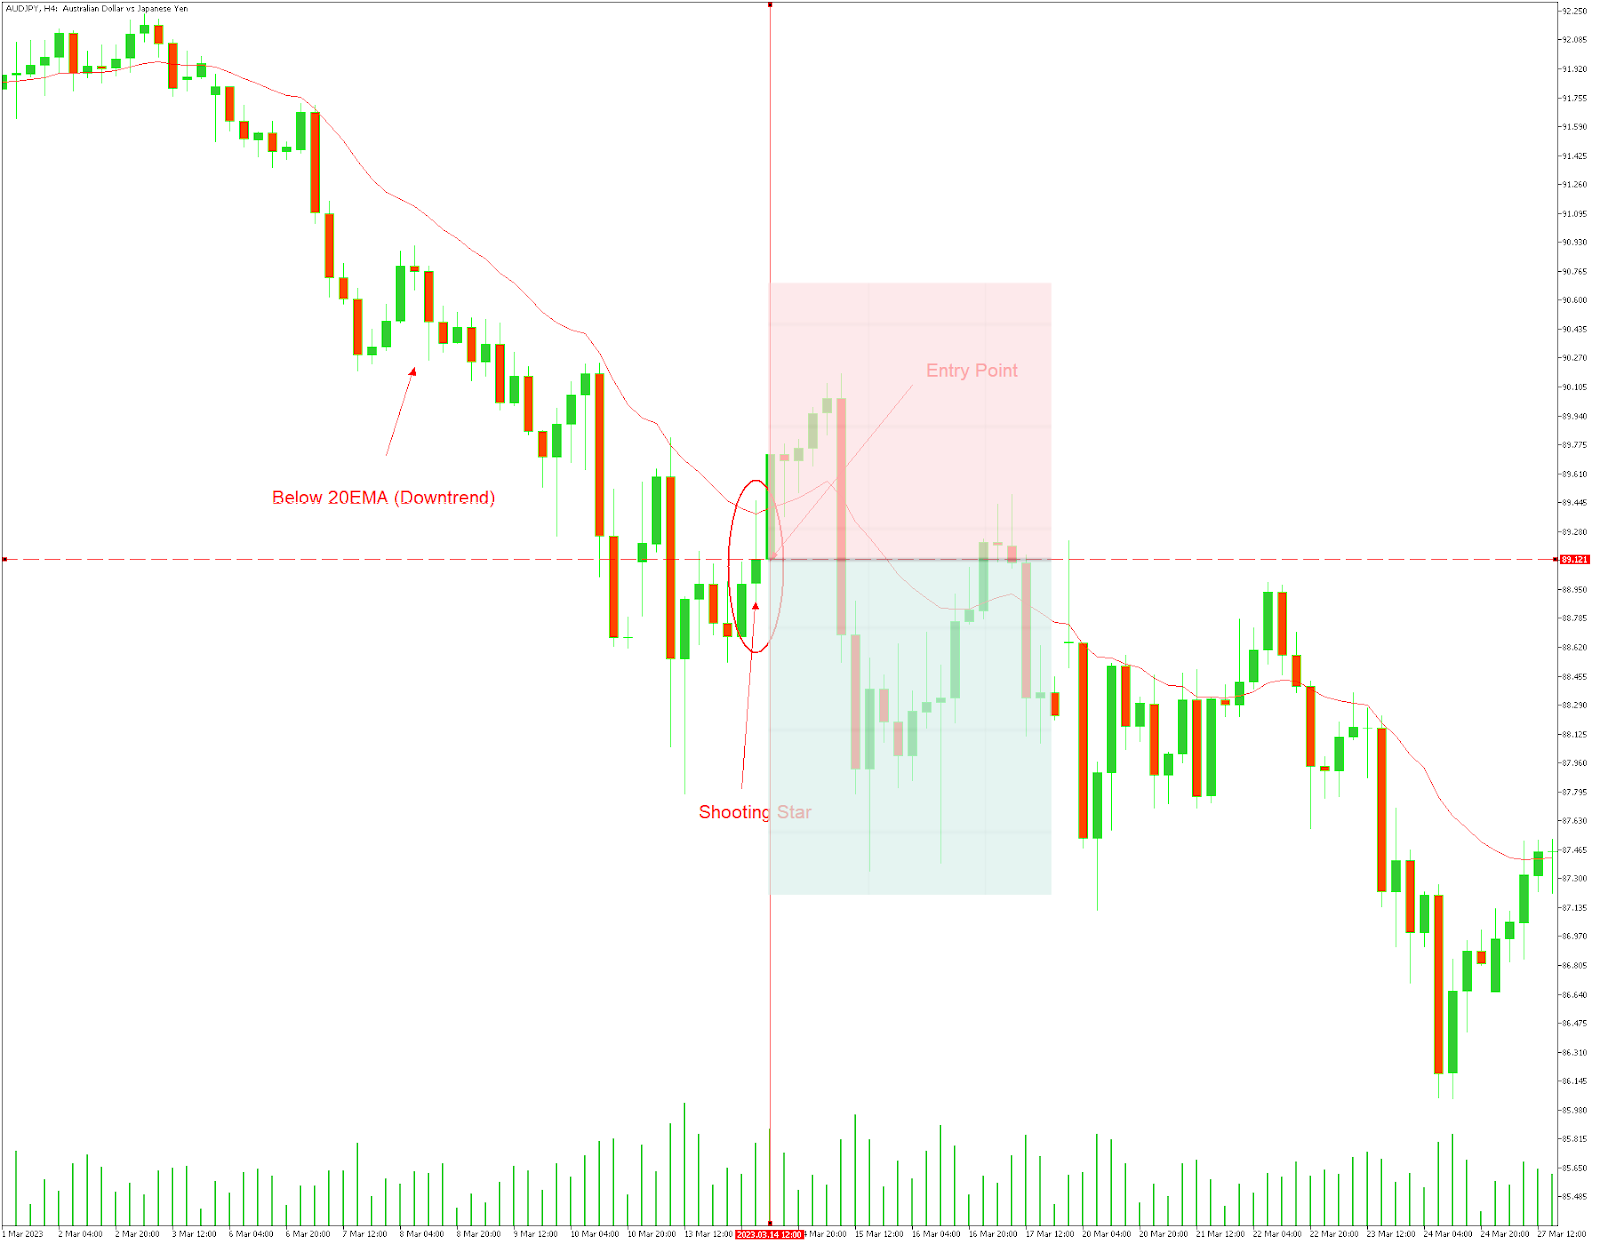
Here we have price below 20 EMA, so we are in a downtrend, our next step would be to wait for 38.2 candle to emerge and test 20 EMA, after shooting star closes that would be our que for entry. Loss stop would be the previous lower high resistance level, or we could place stop 1xATR above the high of the shooting star candle. This time we used 1.4/1 Reward Risk ratio, you can use lower R/R 1.2/1, or even one to one risk reward ratio. As you can see the strategy worked quite well.
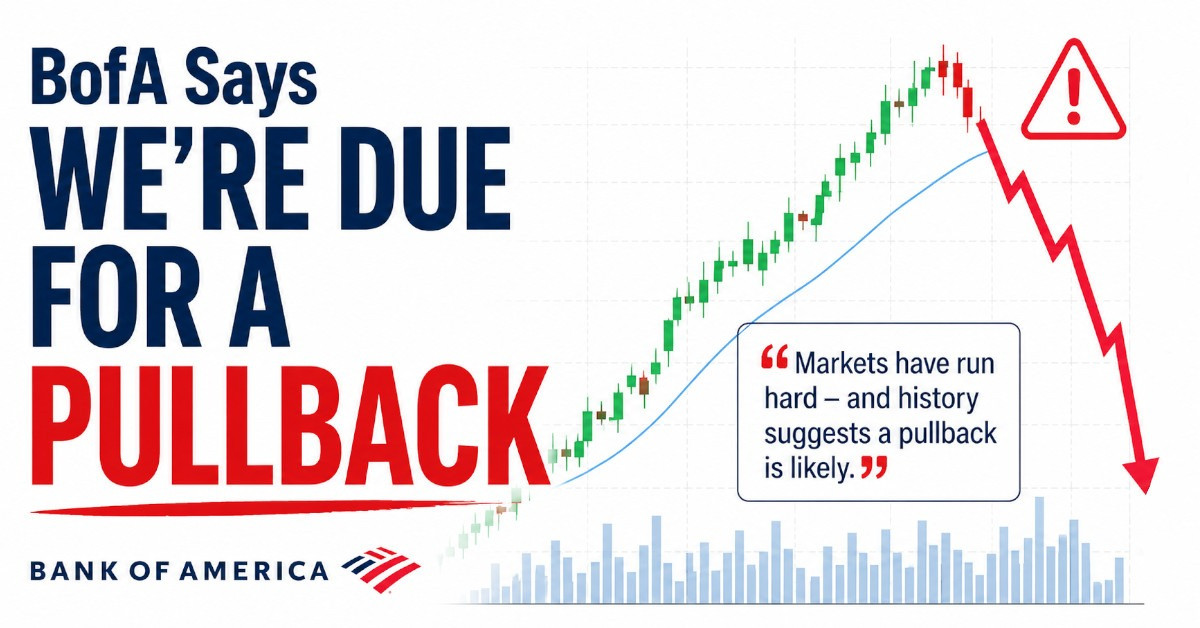
As a reminder, there are no 100% working trading strategies otherwise everyone would use them and they would stop working. Always back-test the strategies you are going to use, see if win loss ratio is acceptable for you and only then start trading with a real account.
So this was an example of trading strategy using shooting star candlestick pattern and rules that are an integral part of profitable trading strategy.
If you liked the strategy try it on DEMO or if you are already trading with real money feel free to use it on a live account.