During this strategy we will use two different timeframes, one of which will help us identify the trend of the price, so we would know whether we will buy or sell.
Let us explain more by showing it on the chart.
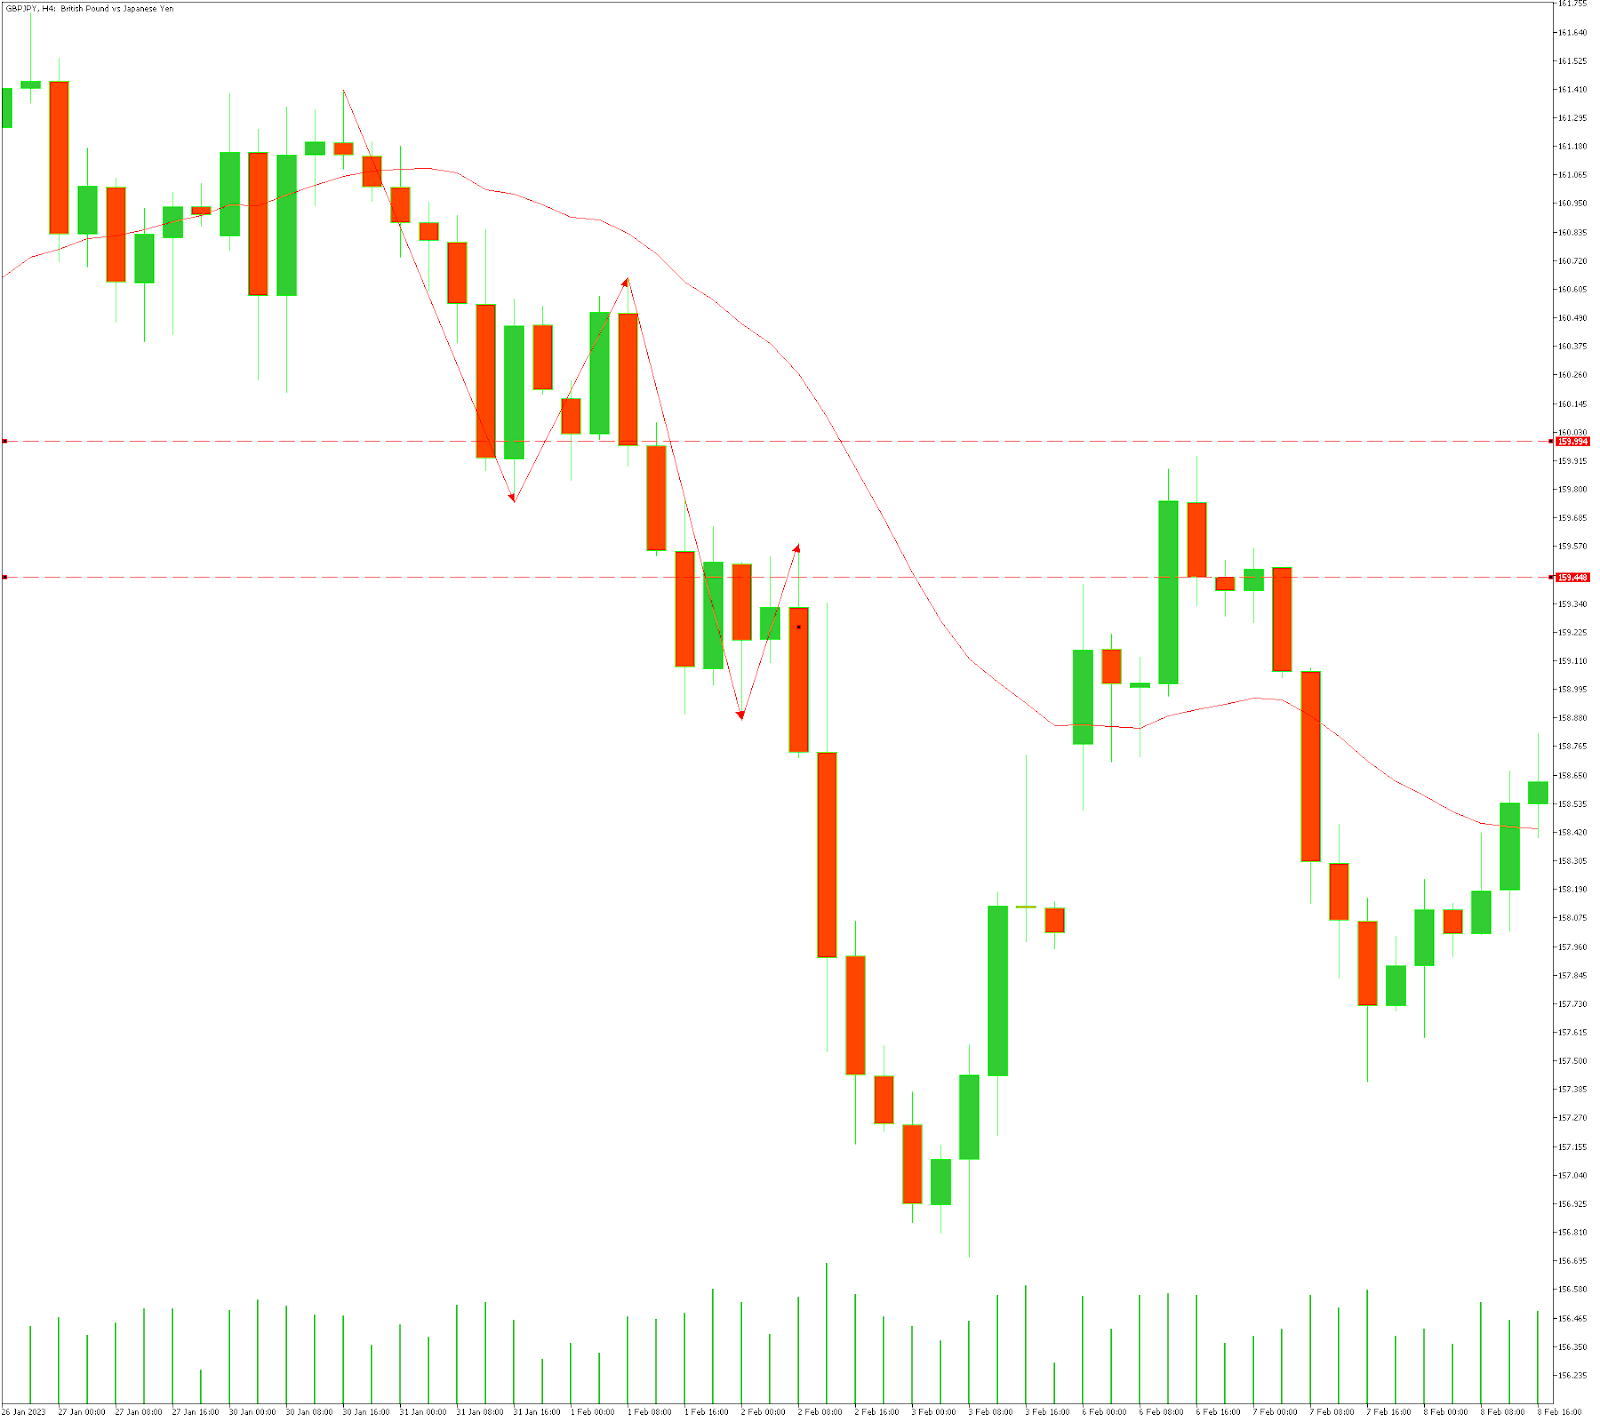
First of all we are going to apply 50 EMA indicator, so what we are looking for here is the price to go above the line and constantly make higher highs and higher lows.
Note, if the price isn’t showing clear higher highs and higher lows, instead it looks more like price consolidation, it’s better to refrain from trading and wait until there is a clear trend.
So after we can clearly see the trend, in this case uptrend, it means that we are going to look for buy trades. After we know which direction we are going to trade, our next step is to identify where to open the position. With this strategy our entry point is clear, we are looking for one place to place buy/sell trade, in this case buy. It will be at the previous high that was just broken, which is the previous level of resistance that is likely to become support. This is the area we are looking for price to pull back and and then go up - that’s where we will place the buy order.
Take a look at a chart:

- We can see that our price is constantly making higher highs and higher lows, and is above the 50 EMA.
- After we see the next higher high, we will be looking at the previous higher high and point out the previous level of resistance.
- Now we are in a zone of buy, and our next step is to wait for the pullback to our zone of the previous resistance area, and then we will go to a lower timeframe (M15) in order to place the trade.
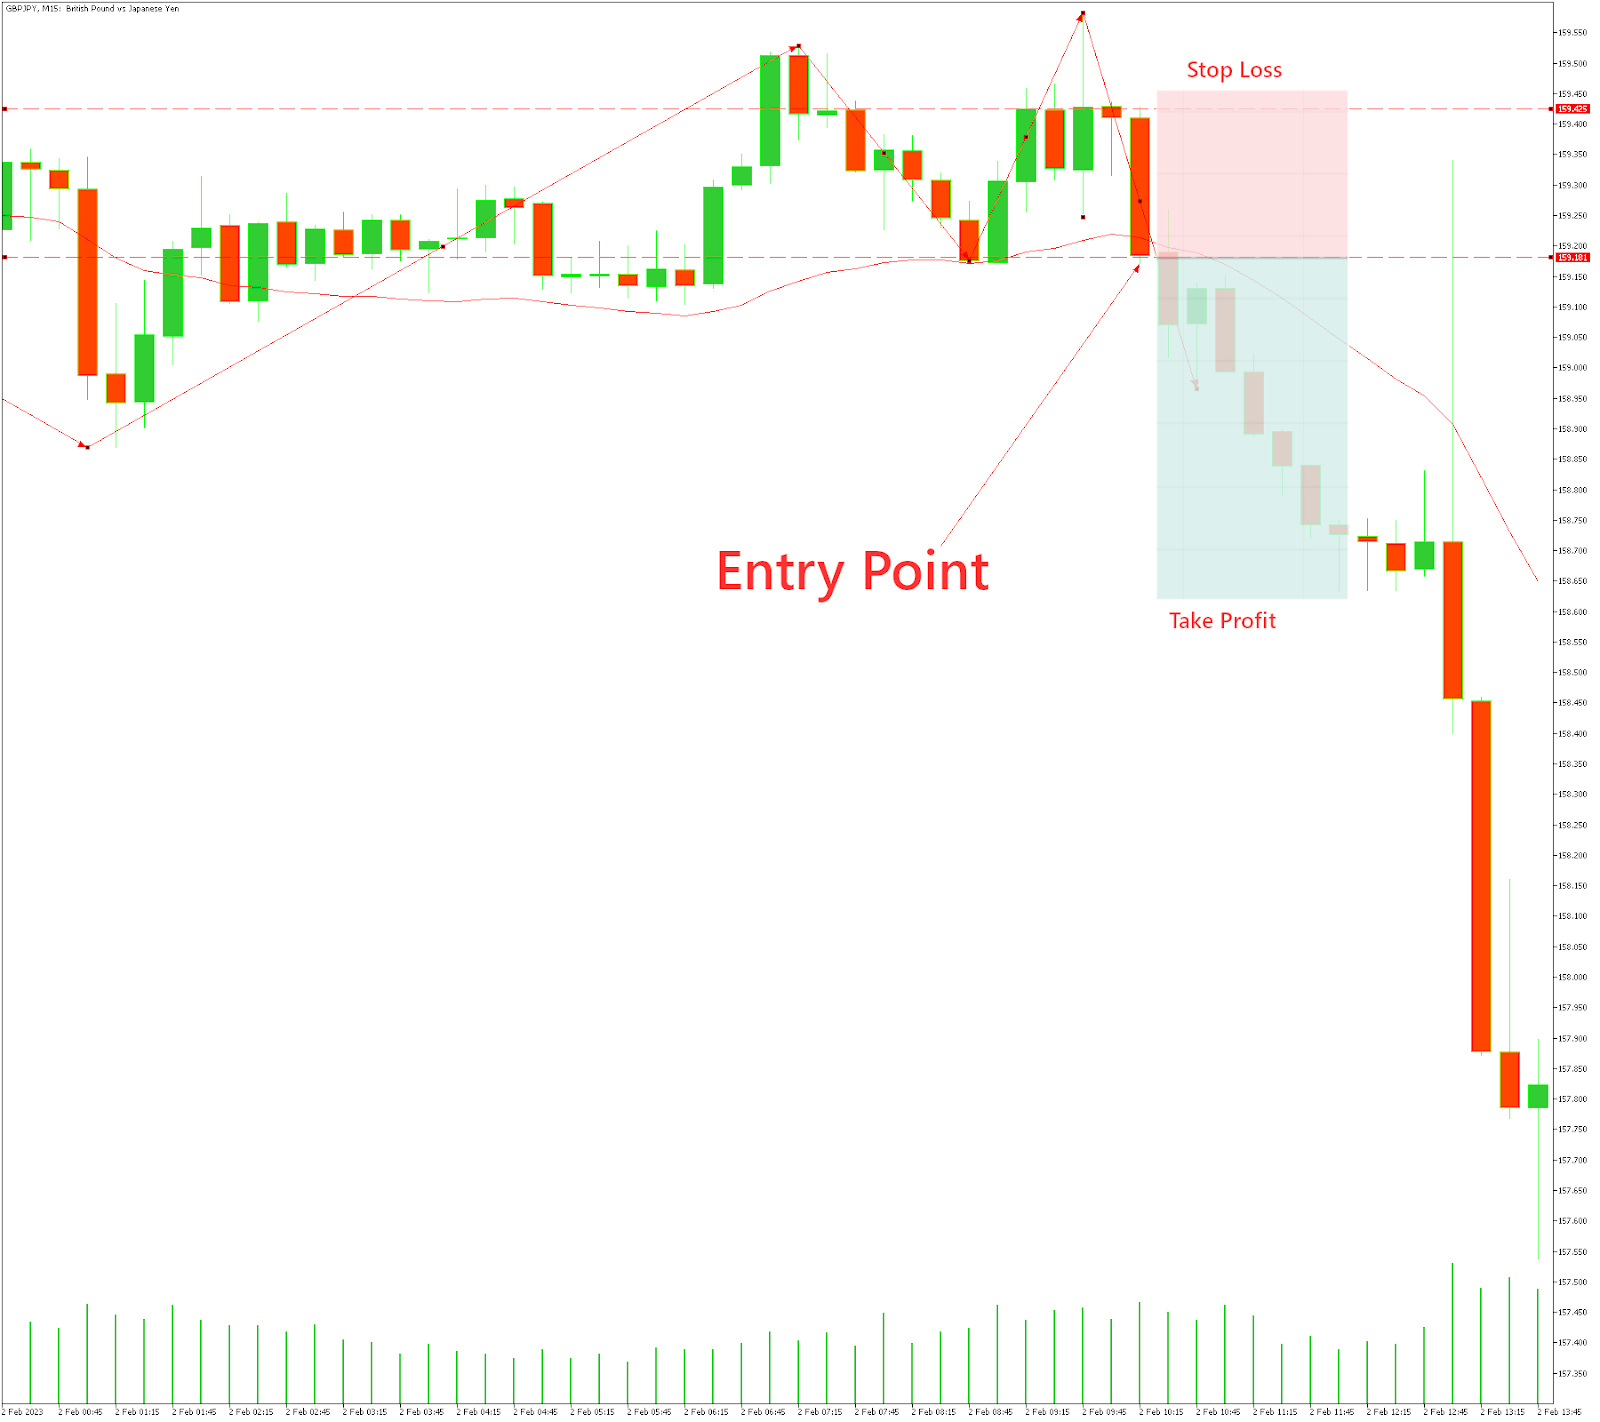
- Now on a M15 timeframe we are looking for two very specific chart patterns; either double bottom chart pattern, or head and shoulders.
- In our case we have a double bottom pattern, we will wait until the neckline is broken, and then place the order.
- Risk reward ratio 1/1.4
Here we go let’s see what happened with the price

Let’s summarize the conditions of this strategy
- On 4H chart with clear uptrend or downtrend and a pullback to the previous resistance, that was broken before
The entry conditions
- On a M15 timeframe we will be looking for two very specific chart patterns; either double bottom chart pattern, or head and shoulders and price breaking above the neckline.
Stops and Target
- Stop loss would go below the buy zone. And the last R/R = 1/1.4
Let’s now test our strategy on bearish example
We want to see price hit new lower lows and lower highs below the 50 EMA, when that starts to happen, instead of previous resistance, we are actually going to look at the previous support level, where price has just broken and we are going to be waiting for price to get back up to that level. Then we will switch to a 15M timeframe to look for either for double tops, or head and shoulders and the entry will be the break of the neckline.
But unfortunately there is no 100% strategy and I can`t stress this enough, you should try the strategy many times on a demo account or on a live account and see the win/loss ratio if the winning trades outnumber the losing trades. it`s a go!