Analyzing the zigzag pattern is essential for traders and technical analysts who want to identify potential trend reversals or corrections in financial markets.
The zigzag pattern is a common chart pattern characterized by a series of alternating price swings, forming distinct peaks and troughs. Zigzag pattern is often associated with Elliott Wave Theory, which suggests that price movements follow a five-wave impulse pattern (trend) and a three-wave corrective pattern (zigzag).
Let’s go step-by-step and analyze the zigzag pattern
The zigzag trading strategy is a technical analysis tool that can help you identify trend reversals and significant price movements in financial markets. It involves drawing zigzag lines on a price chart, connecting significant peaks and troughs (swings).
Zigzag strategy can be used on various timeframes and instruments, and we are going to use it on EUR/USD forex pair.
I will provide a general example of how you might use the zigzag trading strategy on the EUR/USD forex pair. Keep in mind that successful trading requires careful risk management and comprehensive analysis, so always practice on a demo account first before trading with real money.
Here`s a step-by-step example of the zigzag trading strategy on EUR/USD:
Use Price Chart: Use a charting platform or trading software that offers the EUR/USD currency pair and allows you to plot the zigzag indicator. Popular charting platforms include MetaTrader, NetTradeX, and others.

Apply Zigzag indicator: In the zigzag indicator settings, you`ll need to define the parameters for identifying peaks and troughs. For example, you can set a minimum percentage or pip movement required to form a peak or trough. The parameters depend on your trading style and the timeframe you`re using.
Identify Peaks and Troughs: Once the zigzag indicator is applied to your EUR/USD chart, it will plot lines connecting significant peaks (highs) and troughs (lows) on the price chart.

Determine Trend Direction: Analyze the zigzag lines to determine the prevailing trend direction. When the zigzag lines are making higher highs and higher lows, it indicates an uptrend. Conversely, lower highs and lower lows suggest a downtrend.

Look for Reversal Signals: The zigzag indicator helps traders spot potential trend reversals. When the zigzag line changes direction, it could signal a possible reversal in the EUR/USD price movement.

Combine with Other Indicators: Enhance your analysis by combining the zigzag strategy with other technical indicators like moving averages, RSI (Relative Strength Index), or MACD (Moving Average Convergence Divergence). These indicators can provide additional confirmation or filter out false signals.

Set Entry and Exit Points: Based on your analysis, determine entry and exit points for your trades. You might consider placing buy orders when the zigzag indicates an upward reversal and sell orders when it signals a downward reversal.
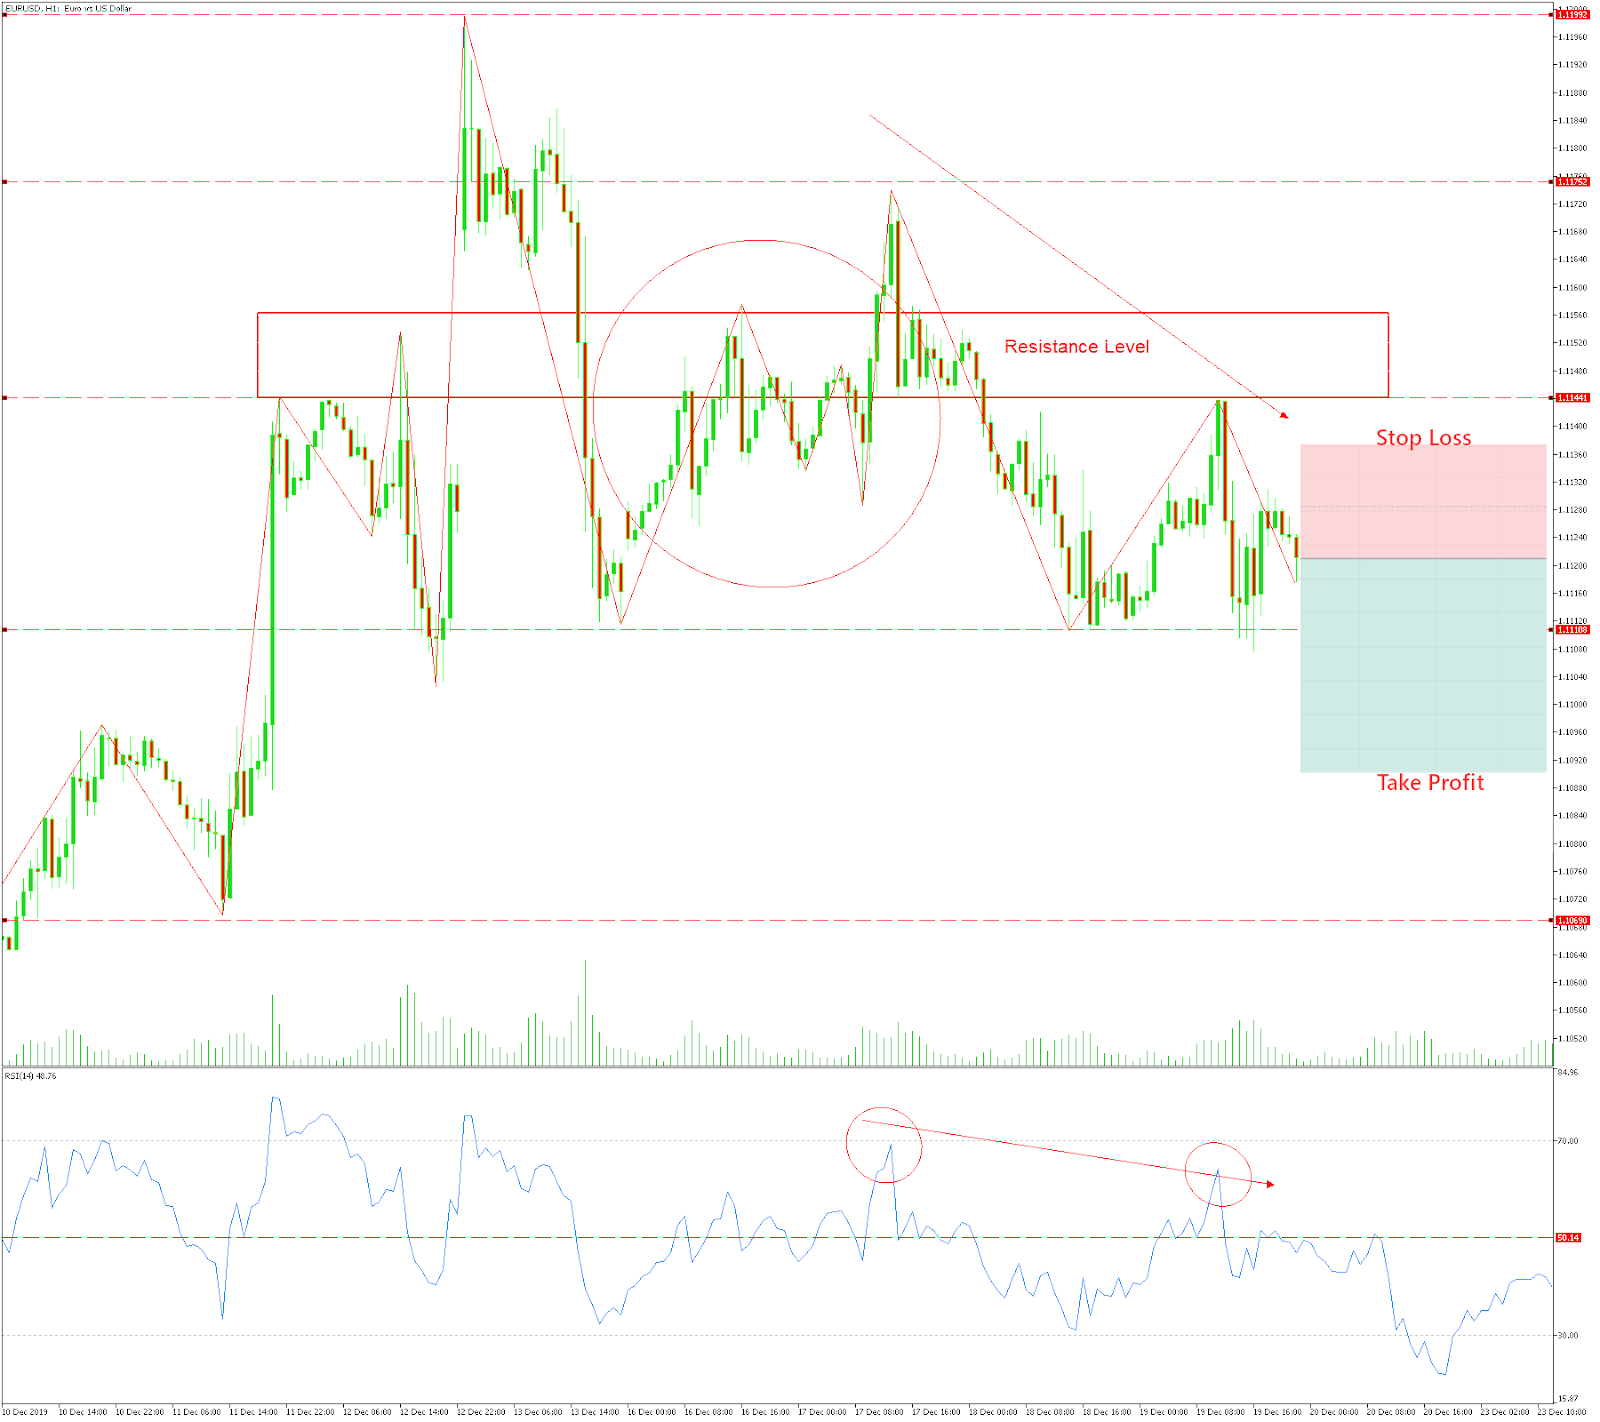
Implement Risk Management: Before entering any trade, establish appropriate risk management measures. Set stop-loss orders to limit potential losses and calculate position sizes based on your risk tolerance and account balance.
Remember that no trading strategy is bulletproof, and the zigzag strategy is no exception. Always backtest your trading approach, practice on a demo account, and continuously monitor and adjust your strategy based on market conditions.