Can the crypto market recover again?
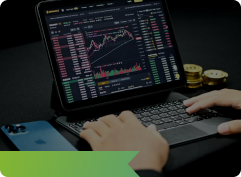
The FGI (known as the Crypto Fear & Greed Index) is a free and easy-to-use index that shows us the daily general market sentiment, based on a variety of weighted factors. For BTC, it is now moving on 16, as you can see in the bellow figure.

As it was expected and I repeatedly mentioned in the past weeks, Bitcoin, the largest market cap crypto, lost more than 20% of its value in the weekend, and now it is trading 20,000 USD lower than its all-time high, seen less than a month ago. And now, as you saw above, Crypto Fear & Greed Index (FGI) confirms that the cryptocurrency market is currently in the “Extreme Fear” condition.
FGI is updating every 24 hours, showing numbers between 0-100 scales. 0-50 representing varying degrees of Fear and 50-100 representing varying degrees of Greed. Traders usually buy above 50 and wait when it falls under 50 to find a better buy opportunity. Since the cryptocurrency market is so sensitive, looking at this chart always is very important to find out the market sentiment.
While many traders stop trading and buy when it moves in extreme fear, this environment also could be a buying opportunity.
On the other hand, we had some unapproved reports that Joe Biden’s Democratic government is mining bitcoins for funds to cover its huge tax bill, disclosure was made by bitcoin mining expert and government advisor, Whit Gibbs, during an interview.
Anyway, who is mining, is not something that, market participants would be interested in. Anyway, it is mining, therefore, where and how we can use it is more important. So far main market-leading news is the stable coins conditions. Regulators recently focused on Stable Coins and their backup for the coins that they had published. If we add to the news about GOP lawmakers' effort to cut off the supply by banning mining, we can understand that generally market sentiment still cannot support any bullish trend, unless if something special happens.
From the technical point of view, 49,500 as 50% of its Fibonacci level, in its latest free-fall from almost 58K to 42K, is the key level. Breathing and trading above this level can give cows some hope in the short term, while trading under this level is the clear bearish signal.