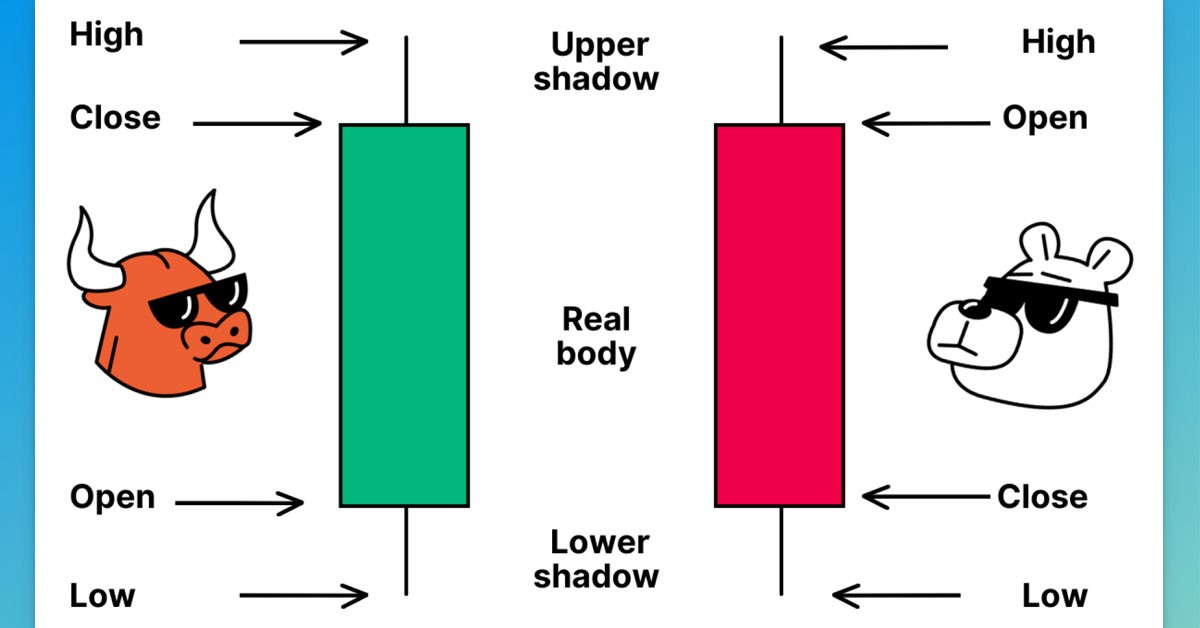
Trading experience has shown that there are two candlestick patterns that stand out from the rest. These 2 candlestick patterns work so well that many experienced traders use them.
In this article we are going to show how to identify them, so there would be no confusion and explain a systematic strategy that uses these 2 candlestick patterns and can jumpstart your profitable trading career.
First off, it’s quite overwhelming trying to remember every single chart pattern, plus there is no magical candlestick pattern that would win let’s say 80% of trades, instead it’s better to see candlestick patterns as small pieces to a larger part of the puzzle. Your trudging strategy is the whole puzzle, candlesticks pattern that you choose to use is just a small piece of that.
The idea is to find the candlesticks patterns that work for you best and then incorporate them into your trading strategy.
Let’s go ahead with the example and see the whole process through!
We are going to review:
- Bullish Engulfing Pattern
- Bearish Engulfing Pattern
- Hammer Pattern
- Shooting Star Pattern
One of key components of having successful trading strategy is having rules for every aspect of your strategy, this strategy is going to be trend continuation so our first rule is
To use 20 EMA, 50 EMA - to establish trend and direction of the market
Also we will combine trend with areas of value
- 20 EMA and 50 EMA - they often act as support and resistance
- Stochastic Extremes (below20, above 80)
- Support or resistance level looking left less than 100 candles
Now 2 out of three of the above conditions should be met.
Entries
- Bullish or Bearish engulfing bars
- Hammer or Shooting star bars
Now 1 out of two of the above conditions should be met.
Stop Loss and Take profit:
- 1xATR above or below entry candle
- 1/1.4 R/R (risk reward ratio)
Now that we have the rules, our first step is going to be finding a market trend, it’s when we use 20 and 50 EMA, so when 20 EMA is below 50 EMA that means that the market is in a down trend and we are looking for selling opportunities.
Our next step is pointing out 2 out of 3 of the areas of value mentioned above. Right now where the price is 20 EMA is coming into the area of value. We can see a shooting star bar against 20 EMA.
The next question we should answer is, if our Stochastic indicator is at its extremes, the answer is yes, it’s over 80 (overbought).
2 out of 3 conditions are met.
Check out the chart
Now all we have to do is to open a short position with 1/1.4 R/R (risk reward ratio) and put stops. Our stop loss needs to be placed 1xATR above the entry candle, which would be 1.63687 and the profit need to be placed 1.4xATR below the entry candle, would be 1.62315.
As you can see from the chart, strategy worked at this time, but with experience you will learn that there is no strategy that will win all the time. You need to take correct steps, follow rules you have found work well in combination with trend reading strategy, backtest it. You will notice that there are times that strategies work really well and times when not, and that is a very natural part of trend trading.
If you liked the strategy and want to test it, we welcome you to try it on a demo account. Good Luck!


سلام مفیدهست